|
📒 Achieved
|
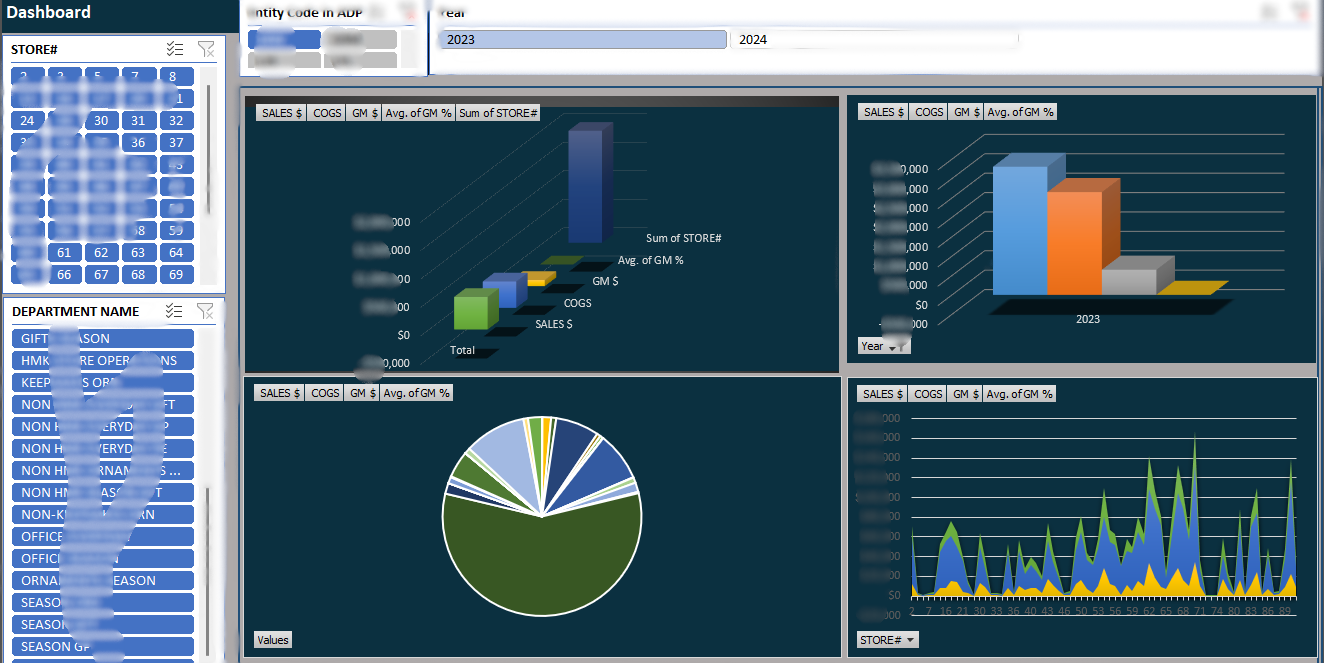
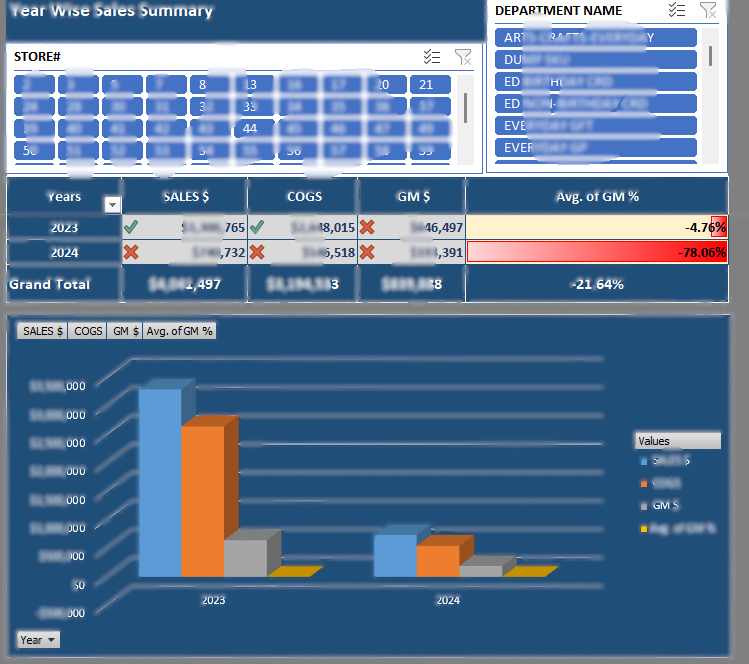
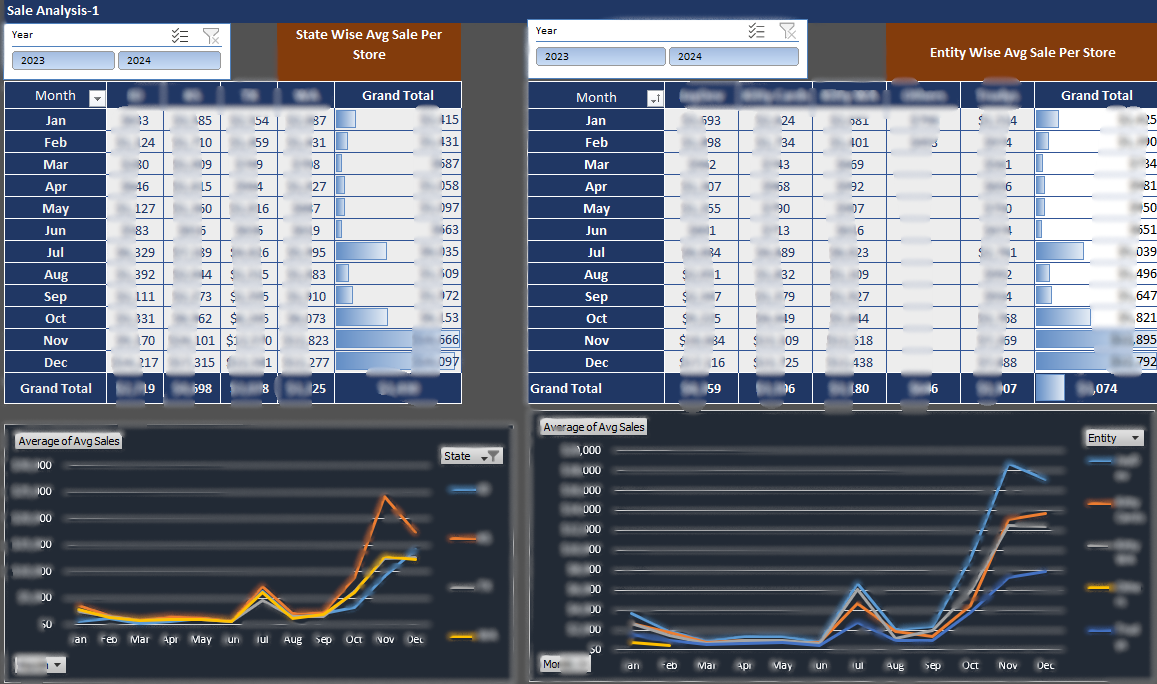
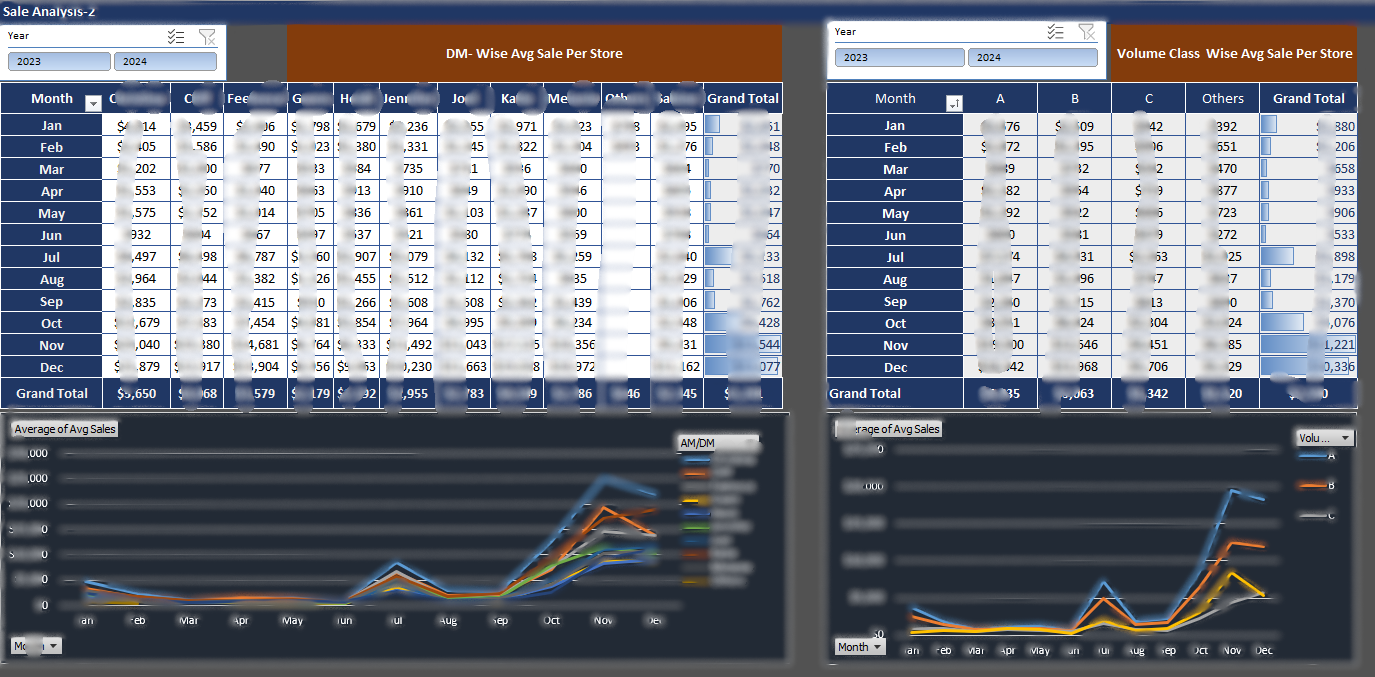
Here we were able to present large data set of over 2 years for 80 stores in a meaningful dashboard. Our client could view and interact with data slicers to see specific data for a store or a product category or performance f a product across months. View Quantity of top 1 selling items. Also view Sales, COGS and gross margins, across months, sliced by Location and product category. View leading products by Category, Location, Year, Month State etc. Contains Dashboard, various tables, cross table summaries and color coded data to view in an easy viewable format.
|